Reducing Water-related Risks
Working to Preserve Water Resources as Shared Natural Capital in Watersheds
The minimization of water-related risks and the solution of local and supply chain water issues
We formulated SEKISUI Environment Sustainability Vision 2050 in 2019 in line with the belief that sustainable operations and development of our businesses requires us to maintain a sound environment in the areas in which we conduct our corporate activities. To realize societies with abundant access to clean water in all the areas in which SEKISUI CHEMICAL Group and its supply chains operate, we have established the following two goals in line with our vision.
<Goals>
-
1.Minimizing water risks at SEKISUI CHEMICAL Group
With the goal of maintaining sustainable operations, SEKISUI CHEMICAL Group will seek to minimize water risks. We will also focus on minimizing risks related to water discharged from Group operations in order to better preserve biodiversity.
-
2.Contributing to the solution of water-related issues in local communities
We will contribute to solving local water issues through collaboration with Products to Enhance Sustainability and watershed stakeholders, aiming not only to minimize water risks but also to return positively to natural capital.
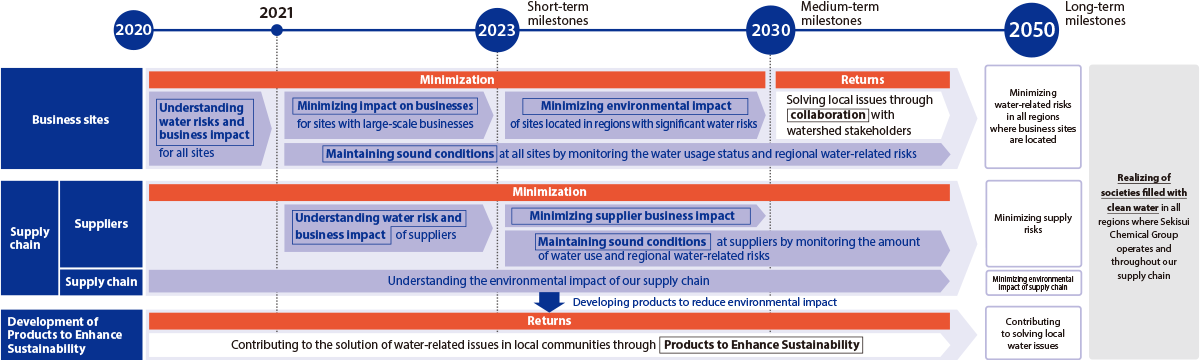
Roadmap to Realize Societies with Abundant Access to Clean Water
SEKISUI CHEMICAL Group has set the goal of realizing societies with abundant access to clean water by 2050, which is the target year of its SEKISUI Environment Sustainability Vision 2050. By backcasting from this goal, we are establishing specific measures and milestones while promoting initiatives.
-
●We will evaluate local water risks and their business impacts and select business sites and suppliers which the business impact is large, and sites where water risks are substantial.
-
●For business sites where the business impact is substantial, we will minimize risks by 2023.
-
●For suppliers which the business impact is substantial, we will minimize risk by 2030, through a review of suppliers.
-
●For business sites which water risks in the region are substantial, we will minimize their environmental impact by 2030.
-
●We will create monitoring guidelines and oversee all locations for both business impacts and environmental impacts.
In order to accelerate returns to natural capital, including the conservation of water resources, we will contribute to solving regional water issues and minimizing the environmental impact on the supply chain by continuously promoting the development of Products to Enhance Sustainability.
Moreover, as an initiative being undertaken at business locations around the world, we will contribute to solving regional water issues by building a collaborative system with stakeholders of the watersheds from 2030 to 2050.
- 11-77
Roadmap
Assessment of the Impact on Businesses from Water-related Risks
In fiscal 2020, the first year of the roadmap for 2050, we conducted assessments of the likely impact on business from water-related risks at all SEKISUI CHEMICAL Group production sites and research institutes.
The Group had conducted a water risk survey in 2013, however seven years have passed. Since then, some business sites have been newly established or closed, and therefore we conducted the study again.
The purpose of this study was to identify water-related issues in the areas in which each business site is located (assessment of external factors) and to identify those sites that exhibit major water risks and those that have a significant impact on the environment.
We undertook quantitative assessments of the business impact of water risks as well as the impact on the environment of our business activities in a bid to identify the water-related issues of the local area. In doing so, we used assessment results drawn from Aqueduct Water Risk Atlas 3.0, a tool for assessing water risks in each region of the world created by the World Resources Institute (WRI), an international environmental NGO and information on water use obtained from individual business sites through questionnaires.
In undertaking assessments, we followed the criteria recommended in the Guidelines for Setting Water Targets for Companies* issued by the CEO Water Mandate.
In fiscal 2021, we identified five domestic and overseas sites that were evaluated as having a large business impact, and established guidelines for business impact and water conservation level initiatives that should be minimized.
- Setting Site Water Targets Informed By Catchment Context: A Guide For Companies
Impact of Water-related Risks on Supply Chain
Manufacturers of steel materials used in the housing business and manufacturers of synthetic resins used in the plastics business are suppliers of raw materials of SEKISUI CHEMICAL Group that consume large quantities of freshwater during their manufacturing process. Although we do not directly call on such suppliers to conform to environmental standards, with our Sekisui Environment Sustainability Index we calculate as use of natural capital the environmental impact of the pollutants contained in drainage generated during the manufacturing process of primary materials and monitor it on a continual basis.
We also evaluate the degree of contribution to the environment through the reduction of impact on the water environment in the Group's business activities and the expansion of products and services that contribute to the improvement and maintenance of the water environment as return to natural capital*.
From fiscal 2020, we have continued to gain a better understanding of, for example, the water risks in our supply chains involving products and the impact of reducing water risk by products on returns to natural capital and social capital.
For more information, see Integrated Index Sekisui Environment Sustainability Index
Contribution to Reduction of Water-related Risks Through Business Operations
SEKISUI CHEMICAL Group develops a range of businesses related to water infrastructure, such as supply, storage, and drainage of water, contributing to society, not only through technologies and products that help to improve the quality of drainage, such as water treatment systems and drain pipes, but also by creating strong water infrastructure made to withstand natural disasters.
For example, the Cross Wave* rainwater collection system, one of our products being marketed in Japan, India, China, Taiwan, and other ASEAN areas, reduces water-related risks. Cross Wave is used to contribute to measures against chronic water shortages, recycling rainwater for both the greening of urban areas and disaster prevention, and also contribute to minimizing damages caused by floods.
With the goal of not only reducing damage from the ever-increasing number of disasters brought on by climate change, but also promoting disaster mitigation in support of recovery efforts after a disaster, we are expanding the peace of mind we can offer to our housing customers by recommending, for example, the installation of a drinking water storage system that uses water infrastructure piping.
-
* Cross Wave:Rainwater storage system. This molded product made from recycled plastic creates an underground space which is used to store rainwater. It regulates the rain volume flowing into sewer systems and rivers during torrential rains and makes reuse of rainwater possible.
Reduction of Water-related Risks at Business Sites with High Water Intake and Discharge Volumes
SEKISUI CHEMICAL Group draws the water it needs to use in its business activities from public water systems, industrial water systems, underground reservoirs, and surrounding rivers.
With the understanding that water is a precious natural resource shared in the community, we do our best to reduce the amount of water used, such as by reusing cooling water.
We have to date established targets and enacted measures for reducing water intake and chemical oxygen demand (COD) of discharged water at each of our production and research facilities. However, based on local water risk conditions and the state of water consumption, we will focus on promoting reduction of water use at business locations where the impact on business is particularly large.
Reduction of Water Intake, and Chemical Oxygen Demand (COD) of Discharged Water
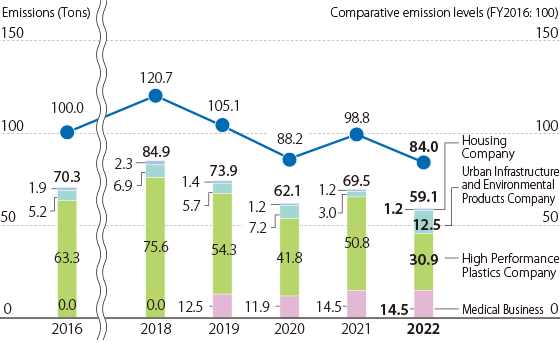
In fiscal 2021, water intake at production sites increased by 4.3% compared with results of the base fiscal year 2016 and by 8.3 compared with the previous year. This is partly due to the addition of four new production sites overseas, but also due to an increase in production volume at factories that produce synthetic resins, which have high water intake volumes. The COD of water discharged which declined by 1.2% compared with results of the base fiscal year of 2016, increased by 12.0% over the previous year. This was also due to an increase in water discharged due to increased production at factories that produce synthetic resins, which have a high drainage volume.
Examples of capex using the environmental contribution investment framework
| Site | Reduction strategy | Result (Expected) | |
|---|---|---|---|
| Reduction in water intake | Shiga-Minakuchi Plant | Introduction of filtration equipment allowing the reuse of recycled wastewater as a coolant. Strengthen management and promoted visualization of water use at the facility. |
Reduction of 9% |
| Sekisui Medical Co., Ltd. Iwate Plant |
10% reduction through automated of industrial water intake adjustment | Reduction of 10% | |
| Reduction in wastewater COD | Sekisui Nano Coat Technology Co., Ltd. | Improve treatment capacity by upgrading wastewater treatment facilities | Reduction of 25% |
Reuse of Discharged Water at Shiga-Minakuchi Plant Started
Engaged in the production of synthetic resins, the Shiga-Minakuchi Plant is the business site with the largest water intake in SEKISUI CHEMICAL Group. The water intake accounts for about 30% of all domestic business sites of the Group, and has been increasing every year since fiscal 2015.
To improve this situation, we undertook comprehensive capital investments aimed at reducing the water intake from fiscal 2018. All investment plans were completed in 2020.
Under this plan, we ascertained the locations and the volumes of industrial water used and then undertook adjustments to the water used in those areas where the amounts were high.
We are also working to reduce the water intake volume by reusing purified water in the 20 cooling towers installed within the site.
- 11-127
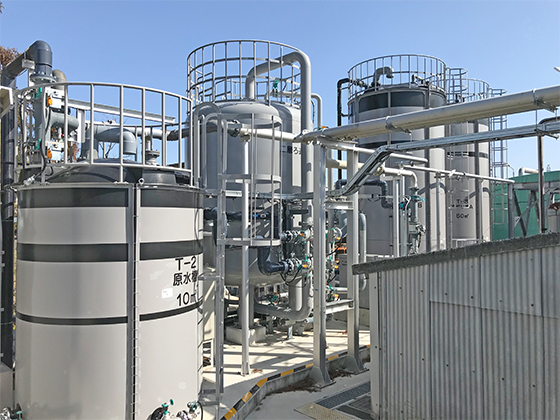
Water filtration equipment at the Shiga-Minakuchi Plant
Increase of Water Treatment Capacity at Sekisui Nano Coat Technology Co., Ltd.
At Sekisui Nano Coat Technology Co., Ltd., wastewater with high-concentration COD is discharged from the degluing and refining processes of textile products and, after passing through their in-house wastewater treatment equipment, discharged into the sea.
In recent years, the amount of wastewater has been decreasing due to changes in the business domains. Also, the COD of wastewater has become difficult to eliminate due to changes in the composition of the glue used in raw materials. Accordingly, we have made improvements to optimize the capacity of the wastewater treatment equipment.
Treatment capacity has been improved by making the treatment process more compact according to the amount of decrease in wastewater and installing a process in which microorganisms suitable for the treatment of persistently decomposed COD particles are optimized.
In fiscal 2021, COD volume of water discharged decreased by 67% compared with 2016 results.
- 11-128
- 11-129
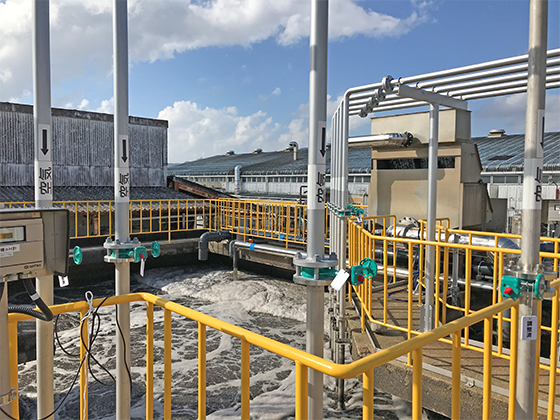
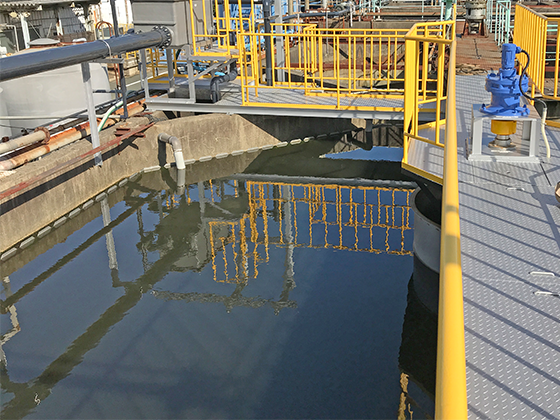
Sekisui Nano Coat Technology wastewater treatment facility
Water Recycling
SEKISUI CHEMICAL Group promotes the reuse of water in its production processes in order to reduce the amount of water it draws from water sources. At the production plants of the UIEP and HPP Companies, large volumes of cooling water is recycled and reused in the manufacturing process. In fiscal 2021, at production sites in Japan and overseas, we used 106 million cubic meters of recycled water. This is equivalent to 4.9 times the total water intake.
In Hasuda City, where the Musashi Plant is located, the wastewater purified at the Musashi Plant in accordance with environmental standards is used as the main water source for Lake Kurohama*, which is designated as a nature conservation area in Saitama Prefecture.
* For more information about Lake Kurohama, see the page below.
-
Note:From fiscal 2019, results from the medical business are collated and presented with Corporate Headquarters results following its separation from the HPP Company.
- 11-80
- 11-81
-
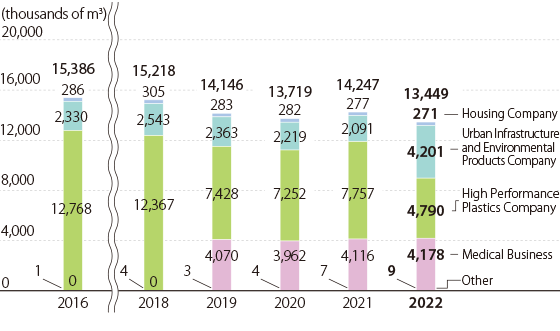
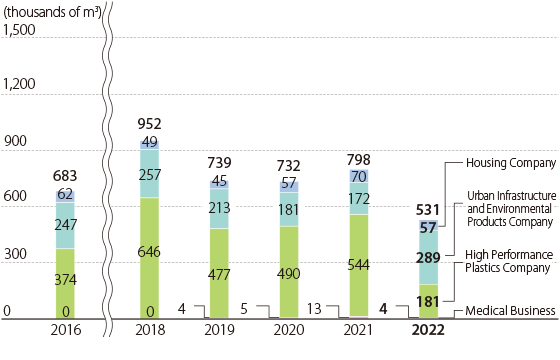
Water Intake at Production Sites / Japan
-
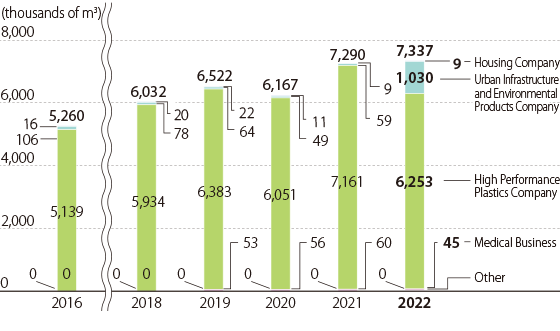
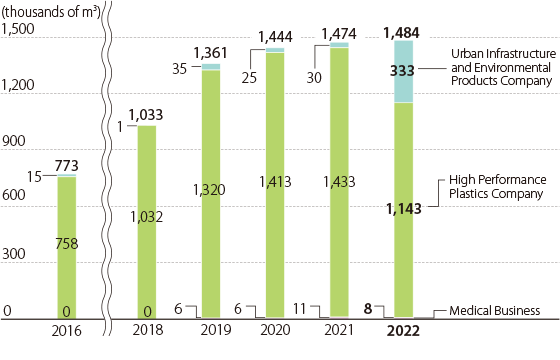
Water Intake at Production Sites / Overseas
- 11-82
- 11-83
-
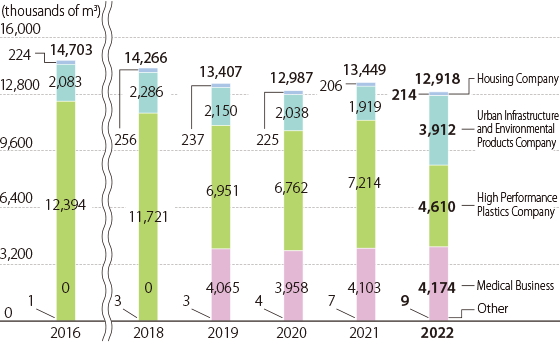
Wastewater Discharge at Production Sites / Japan
-
Wastewater Discharge at Production Sites / Overseas
- 11-84
- 11-85
-
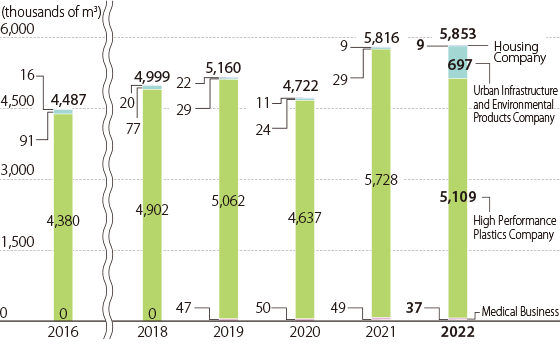
Water Consumption at Production Sites / Japan
-
Water Consumption at Production Sites / Overseas
Water Intake at Production Sites by Water Source
| Water source | Regions | All regions | Areas in regions with water stress | ||||||||||
|---|---|---|---|---|---|---|---|---|---|---|---|---|---|
| 2016 | 2017 | 2018 | 2019 | 2020 | 2021 | 2016 | 2017 | 2018 | 2019 | 2020 | 2021 | ||
| Surface water | Japan | 696 | 1,086 | 197 | 726 | 129 | 185 | 0 | 0 | 0 | 0 | 0 | 0 |
| China | 0 | 0 | 0 | 0 | 0 | 0 | 0 | 0 | 0 | 0 | 0 | 0 | |
| Southeast Asia and Oceania | 0 | 0 | 0 | 1 | 3 | 0 | 0 | 0 | 0 | 1 | 3 | 0 | |
| Europe | 0 | 0 | 0 | 0 | 0 | 0 | 0 | 0 | 0 | 0 | 0 | 0 | |
| North and Central America | 0 | 0 | 0 | 0 | 0 | 0 | 0 | 1 | 0 | 0 | 0 | 0 | |
| Total | 696 | 1,086 | 197 | 727 | 131 | 185 | 0 | 1 | 0 | 1 | 3 | 0 | |
| Ground water | Japan | 2,604 | 2,624 | 2,632 | 2,517 | 2,340 | 2,328 | 0 | 0 | 0 | 0 | 0 | 0 |
| China | 0 | 0 | 0 | 0 | 0 | 0 | 0 | 0 | 0 | 0 | 0 | 0 | |
| Southeast Asia and Oceania | 103 | 120 | 144 | 111 | 121 | 132 | 25 | 26 | 35 | 16 | 22 | 24 | |
| Europe | 0 | 0 | 0 | 0 | 0 | 0 | 0 | 0 | 0 | 0 | 0 | 0 | |
| North and Central America | 4 | 0 | 0 | 0 | 0 | 5 | 0 | 0 | 0 | 0 | 0 | 0 | |
| Total | 2,710 | 2,745 | 2,776 | 2,628 | 2,461 | 2,465 | 25 | 26 | 35 | 16 | 22 | 24 | |
| Seawater | Japan | 0 | 0 | 0 | 0 | 0 | 0 | 0 | 0 | 0 | 0 | 0 | 0 |
| China | 0 | 0 | 0 | 0 | 0 | 0 | 0 | 0 | 0 | 0 | 0 | 0 | |
| Southeast Asia and Oceania | 0 | 0 | 0 | 0 | 0 | 0 | 0 | 0 | 0 | 0 | 0 | 0 | |
| Europe | 0 | 0 | 0 | 0 | 0 | 0 | 0 | 0 | 0 | 0 | 0 | 0 | |
| North and Central America | 0 | 0 | 0 | 0 | 0 | 0 | 0 | 0 | 0 | 0 | 0 | 0 | |
| Total | 0 | 0 | 0 | 0 | 0 | 0 | 0 | 0 | 0 | 0 | 0 | 0 | |
| Third-party water* | Japan | 12,086 | 11,969 | 12,389 | 10,903 | 11,250 | 11,734 | 0 | 0 | 0 | 0 | 0 | 0 |
| China | 273 | 298 | 324 | 265 | 247 | 243 | 236 | 288 | 311 | 256 | 241 | 235 | |
| Southeast Asia and Oceania | 896 | 1,097 | 966 | 1,093 | 957 | 1,087 | 18 | 46 | 72 | 80 | 55 | 42 | |
| Europe | 1,943 | 1,883 | 1,866 | 1,960 | 1,674 | 2,527 | 1,857 | 1,799 | 1,805 | 1,887 | 1606 | 2,444 | |
| North and Central America | 2,042 | 2,209 | 2,732 | 3,092 | 3,165 | 3,297 | 10 | 81 | 156 | 141 | 94 | 121 | |
| Total | 17,241 | 17,456 | 18,278 | 17,313 | 17,293 | 18,887 | 2,121 | 2,213 | 2,344 | 2,365 | 1,996 | 2,842 | |
| Total volume of water withdrawn | Japan | 15,386 | 15,679 | 15,218 | 14,146 | 13,719 | 14,247 | 0 | 0 | 0 | 0 | 0 | 0 |
| China | 273 | 298 | 324 | 265 | 247 | 243 | 236 | 288 | 311 | 256 | 241 | 235 | |
| Southeast Asia and Oceania | 999 | 1,217 | 1,110 | 1,204 | 1,081 | 1,219 | 44 | 72 | 107 | 97 | 80 | 65 | |
| Europe | 1,943 | 1,883 | 1,866 | 1,960 | 1,674 | 2,527 | 1,857 | 1,799 | 1,805 | 1,887 | 1,606 | 2,444 | |
| North and Central America | 2,046 | 2,209 | 2,732 | 3,092 | 3,165 | 3,301 | 10 | 81 | 156 | 141 | 94 | 121 | |
| Total | 20,646 | 21,286 | 21,250 | 20,668 | 19,885 | 21,537 | 2,146 | 2,239 | 2,379 | 2,382 | 2,021 | 2,866 | |
| Surface water | Japan | 11,219 | 11,627 | 11,353 | 10,680 | 10,179 | 10,623 | 0 | 0 | 0 | 0 | 0 | 0 |
| China | 0 | 0 | 0 | 0 | 0 | 0 | 0 | 0 | 0 | 0 | 0 | 0 | |
| Southeast Asia and Oceania | 22 | 26 | 20 | 43 | 18 | 13 | 2 | 2 | 0 | 22 | 4 | 1 | |
| Europe | 0 | 0 | 0 | 0 | 0 | 0 | 0 | 0 | 0 | 0 | 0 | 0 | |
| North and Central America | 0 | 0 | 0 | 0 | 0 | 0 | 0 | 0 | 0 | 0 | 0 | 0 | |
| Total | 11,241 | 11,653 | 11,372 | 10,722 | 10,197 | 10,636 | 2 | 2 | 0 | 22 | 4 | 1 | |
| Ground water | Japan | 0 | 0 | 0 | 0 | 0 | 0 | 0 | 0 | 0 | 0 | 0 | 0 |
| China | 0 | 0 | 0 | 0 | 0 | 0 | 0 | 0 | 0 | 0 | 0 | 0 | |
| Southeast Asia and Oceania | 0 | 0 | 0 | 0 | 0 | 0 | 0 | 0 | 0 | 0 | 0 | 0 | |
| Europe | 0 | 0 | 0 | 0 | 0 | 0 | 0 | 0 | 0 | 0 | 0 | 0 | |
| North and Central America | 0 | 0 | 0 | 0 | 0 | 0 | 0 | 0 | 0 | 0 | 0 | 0 | |
| Total | 0 | 0 | 0 | 0 | 0 | 0 | 0 | 0 | 0 | 0 | 0 | 0 | |
| Seawater | Japan | 2,892 | 2,503 | 2,277 | 2,160 | 2,293 | 2,205 | 0 | 0 | 0 | 0 | 0 | 0 |
| China | 0 | 0 | 0 | 0 | 0 | 0 | 0 | 0 | 0 | 0 | 0 | 0 | |
| Southeast Asia and Oceania | 0 | 0 | 0 | 0 | 0 | 0 | 0 | 0 | 0 | 0 | 0 | 0 | |
| Europe | 0 | 0 | 0 | 0 | 0 | 0 | 0 | 0 | 0 | 0 | 0 | 0 | |
| North and Central America | 0 | 0 | 0 | 0 | 0 | 0 | 0 | 0 | 0 | 0 | 0 | 0 | |
| Total | 2,892 | 2,503 | 2,277 | 2,160 | 2,293 | 2,205 | 0 | 0 | 0 | 0 | 0 | 0 | |
| Third-party water* | Japan | 591 | 614 | 636 | 567 | 515 | 622 | 0 | 0 | 0 | 0 | 0 | 0 |
| China | 272 | 287 | 308 | 255 | 237 | 233 | 235 | 277 | 296 | 246 | 232 | 226 | |
| Southeast Asia and Oceania | 679 | 867 | 830 | 860 | 790 | 881 | 26 | 55 | 103 | 60 | 54 | 37 | |
| Europe | 1,930 | 1,874 | 1,860 | 1,944 | 1,664 | 2,511 | 1,857 | 1,799 | 1,805 | 1,875 | 1,601 | 2,439 | |
| North and Central America | 1,585 | 1,571 | 1,981 | 2,060 | 2,012 | 2,177 | 9 | 62 | 79 | 81 | 62 | 62 | |
| Total | 5,057 | 5,213 | 5,615 | 5,685 | 5,219 | 6,424 | 2,127 | 2,193 | 2,283 | 2,262 | 1,949 | 2,764 | |
| Total Volume of Wastewater | Japan | 14,703 | 14,744 | 14,266 | 13,407 | 12,987 | 13,449 | 0 | 0 | 0 | 0 | 0 | 0 |
| China | 272 | 287 | 308 | 255 | 237 | 233 | 235 | 277 | 296 | 246 | 232 | 226 | |
| Southeast Asia and Oceania | 701 | 893 | 850 | 902 | 809 | 895 | 29 | 57 | 103 | 83 | 58 | 38 | |
| Europe | 1,930 | 1,874 | 1,860 | 1,944 | 1,664 | 2,511 | 1,857 | 1,799 | 1,805 | 1,875 | 1,601 | 2,439 | |
| North and Central America | 1,585 | 1,571 | 1,981 | 2,060 | 2,012 | 2,177 | 9 | 62 | 79 | 81 | 62 | 62 | |
| Total | 19,190 | 19,370 | 19,265 | 18,567 | 17,709 | 19,265 | 2,129 | 2,195 | 2,283 | 2,285 | 1,952 | 2,765 | |
- Third-party wastewater: Wastewater discharged to wastewater treatment facilities of local governments, etc. (sewer systems)
Water Consumption at Production Sites
| Regions | All regions | Areas in regions with water stress | ||||||||||
|---|---|---|---|---|---|---|---|---|---|---|---|---|
| 2016 | 2017 | 2018 | 2019 | 2020 | 2021 | 2016 | 2017 | 2018 | 2019 | 2020 | 2021 | |
| Japan | 683 | 935 | 952 | 739 | 732 | 798 | 0 | 0 | 0 | 0 | 0 | 0 |
| China | 1 | 11 | 16 | 10 | 10 | 9 | 1 | 11 | 16 | 10 | 10 | 9 |
| Southeast Asia and Oceania | 298 | 324 | 260 | 302 | 272 | 324 | 15 | 15 | 4 | 15 | 22 | 27 |
| Europe | 13 | 9 | 6 | 17 | 9 | 16 | 0 | 0 | 0 | 13 | 5 | 6 |
| North and Central America | 461 | 638 | 751 | 1,032 | 1,153 | 1,125 | 1 | 19 | 77 | 60 | 33 | 59 |
| Total | 1,456 | 1,916 | 1,985 | 2,101 | 2,176 | 2,272 | 17 | 45 | 97 | 98 | 69 | 101 |
| Indicator | Calculation Method |
|---|---|
| Water intake | Water intake = Total water intake = (The sum of water intake from surface water, ground water, seawater, and third-party water) |
| Wastewater discharge | Wastewater discharge = Total wastewater discharge = (The sum of wastewater discharged to surface water, ground water, seawater, and third-party wastewater) |
| Water consumption | Water consumption = Water intake - wastewater discharge |
| Areas in regions with water stress | Areas where Baseline Water Stress is ranked as High or Extremely High under the WRI Aqueduct™ Water Risk Atlas (Aqueduct 3.0) Evaluation System |
- 11-90
-
COD Discharge / Japan
| Indicator | Calculation Method |
|---|---|
| COD Discharge | Discharge = Σ[COD concentration (annual average of measured values) x Water discharge volume] |