Indicators and Targets
- Targets
- Environmental Medium- to Long-term Plan and FY2023 Results
- Integrated index SEKISUI Environment Sustainability Index
- Scope of Tabulation for Environmental Performance Data
- Environmental Accounting
- Material Balance
- Setting Self-management Targets
Targets
The long-term goal of SEKISUI CHEMICAL Group's environmental activities is to realize an earth with maintained biodiversity as stated in its Long-term Environmental Management Vision, SEKISUI Environment Sustainability Vision 2050. To this end, we believe it is important to simultaneously achieve the such long-term goals for environmental issues as climate change, resource recycling, and water risks.
In the current Environmental Medium-term Plan, SEKISUI Environment Sustainability Plan: EXTEND (FY2023-2025), we focus on improving the quality of solutions to avoid imposing any negative impact on each of the aforementioned environmental issues.
Progress on each environmental issue is managed by setting milestones that are backcast from long-term goals and are based on individual management targets. The SEKISUI Environment Sustainability Index, an integrated indicator, is used to monitor the progress of environmental issues as a whole.
Environmental Medium- to Long-term Plan and FY2023 Results
Environmental Medium- to Long-term Plan and FY2023 Results (Environmental Medium-term Plan SEKISUI Environment Sustainability Plan: EXTEND (FY2023-2025)
✓: FY2023 target achieved
×: FY2023 target not achieved
| Initiatives | Goals | Level Setting Guidelines | Indicators | Base year | FY2023 Targets and Results | Self-evaluation | Reference Page(s) | FY2024 Targets | FY2025 Targets | FY2030 Targets | FY2050 Targets | Targets | |||||||
|---|---|---|---|---|---|---|---|---|---|---|---|---|---|---|---|---|---|---|---|
| FY2023 Targets | FY2023 Results | Domestic (Japan) Sites | Research Facilities | Domestic (Japan) Offices | Overseas Production Sites | Overseas Offices | Other | ||||||||||||
| Progress management through the Integrated Index | Achieve an earth with maintained biodiversity through corporate activities | Environmental returns that exceed environmental impact | SEKISUI Environmental Sustainability Index Rate of return to natural and social capital | ー | Maintain 100% or more |
106% | ✓ | Detail | Maintain at 100% or more |
Maintain at 100% or more |
Maintain at 100% or more |
Maintain at 100% or more |
✓ | ✓ | ✓ | ✓ | ✓ | ✓ | |
| Products to Enhance Sustainability | TOTAL | Achieve a balance between economic and social value | Doubling of the Group’s business by 2030 | Net Sales of Products to Enhance Sustainability | ー | 960 billion yen | 950.2 billion yen | × | Detail | ー | Over 1 trillion yen | ー | ー | ||||||
| By major environmental issue | Contribute to the promotion of resource recycling (particularly carbon) | Realization of a recycling-based society | Increase in sales of products that contribute to resource recycling | 2020 55.3 billion yen |
1.6 times (88.5 billion yen) |
99 billion yen | ✓ | Detail | 1.65 times (91.2 billion yen) |
1.7 times (94 billion yen) |
Double or more (110.6 billion yen) | All products | |||||||
| Net Sales of products derived from non-fossil fuel sources and use of recycled materials | 2019 3 billion yen |
38.0 billion yen | 34.7 billion yen | × | Detail | 39 billion yen | 40.0 billion yen | 100 billion yen | ー | ||||||||||
| Reduce environmental impact | GHG | Promote decarbonization zero GHG emissions | The Paris Agreement 1.5°C target Realization of a decarbonized society | GHG emission reduction rate | FY2019 | -26% | -32.8% | ✓ | Detail | -30% | -33% | -50% | -100% | ✓ | ✓ | ✓ | ✓ | ✓ | |
| Renewable energy ratio of purchased electricity | ー | 50% | 49.5% | × | Detail | 60% | 70% | 100% | Total power consumption including co-generation 100% | ✓ | ✓ | ✓ | ✓ | ✓ | |||||
| Fuel-source GHG emission reduction rate (including GHGs not arising from energy consumption) | FY2019 | -10% | -15.9% | ✓ | Detail | -10% | -12% | -11% | -100% | ✓ | ✓ | ✓ | ✓ | ✓ | |||||
| Reduce energy usage volume | Improve the efficiency of energy use in production and reduce energy costs | Cost reductions above cost increases from purchasing renewable energy | Reduction rate of energy consumption per unit of production | FY2022 | -1% | +3.5% | × | Detail | -2% | -3% | ー | ー | ✓ | ✓ | |||||
| Resource recycling | Promote resource recycling (particularly carbon) | Realization of a resource-recycling society | Reduction rate of the amount of waste generated per unit of production | FY2022 | -1% | +0.3% | × | Detail | -2% | -3% | ー | Achieve a circular economy | ✓ | ✓ | |||||
| Issue of marine plastics | Recycling rate for waste plastic materials | ー | Japan: 61% (Overseas: Base acquisition) | Japan: 60.7% | × | Detail | Japan: 63% (Overseas: Base +3%) |
Japan: 65% (Overseas: Base +5%) |
100% | 100% | ✓ | ✓ | ✓ | ||||||
| Reduction of resource use in offices | Reduction rate of copier paper use per unit of people | FY2022 | -1% | -6.6% | ✓ | Detail | -2% | -3% | ー | Achieve a circular economy | ✓ | ✓ | |||||||
| Reduction of waste generation at new construction sites | Reduction rate of the amount of waste generated per building at new housing construction sites | FY2022 | -4% | -5.2% | ✓ | Detail | -8% | -12% | ー | Achieve a circular economy | ✓ | ||||||||
| Water-related risk | Minimize business impact due to water-related risks | Enabling of sustainable operations | Implementation of initiatives to minimize the business impact of water-related risks specific to five sites in Japan and Overseas | ー | Efforts to minimize business impact at individual business sites with large business impact | Initiatives decided at all 5 locations | ー | Detail | Efforts to minimize business impact at individual business sites with large business impactEfforts to minimize business impact at individual business sites with large business impact | Minimum to the environment where water-related risks exist | Minimum to the environment where water-related risks exist | ✓ | ✓ | ||||||
| Contribute to solving watershed-specific water issues | Contributions to returns to natural capital | ||||||||||||||||||
| Maintain water resources | No increase in water stress in watersheds | Reduction rate of water intake volume at production sites which use large quantities of water | FY2016 | -10% over a 3-year period | -8.5% | ー | Detail | -10% over a 3-year period | ー | ー | ✓ | ||||||||
| No increase in the impact on watersheds | Reduction rate of total COD volume of river discharge water at production sites with high COD emission volumes | FY2016 | -10% over a 3-year period | -2.7% | ー | Detail | -10% over a 3-year period | ー | ー | ✓ | |||||||||
| Ecosystem | Ecosystem impact: | Biodiversity conservation | JBIB Land Use Score Card® evaluation points | FY2022 | +3 points over a 3-year period | +1.5 points | ー | Detail | +3 points over a 3-year period | Promote ecosystem friendliness at all business sites | Promote ecosystem friendliness at all business sites | ✓ | ✓ | ||||||
| Minimize risks of ecosystem degradation | |||||||||||||||||||
FY2023 Results Against Environment-related KPIs
- Climate change
Rate of GHG reduction-32.8% (compared with FY2019) - Resource recycling
Material recycling rate for waste plastics (Japan) 60.7%
Other Priority Item FY2023 Results
Expand and create markets for Products to Enhance Sustainability
In FY2023, 11 products and services were newly registered.
Specifically, the following is a list of products that contribute to the resolution of resource recycling and climate change issues (certain examples).
-
・ PVC sashes:A product that contributes to the reduction of energy consumption in cold climates due to its thermal insulation and high airtight performance. PVC sashes are recovered after product use and applied as a raw material for other products.
-
・ Standard film Recycling system of interlayer film for laminated glass:Inserted between the laminated glass of vehicle front windshields, this product improves safety by preventing shattering in the event of an accident. Established a mechanism to collect film scraps from BtoB customers for use as raw materials.
In response to the upswing in low-carbon and decarbonization demand, sales of products that contribute to the resolution of climate change issues have expanded, which in turn is contributing to higher overall sales of Products to Enhance Sustainability.
Quantification of the Contribution Effect on Solving Issues through Products
In fiscal 2023, we identified environmental values from products equivalent to 50% of Products to Enhance Sustainability sales.
As far as returns to social capital and value are concerned, we are undertaking economic value conversion using the impact-weighted accounting method.
We visualize the environmental and social value of our products and businesses (the degree to which they contribute to solving problems) and disclose this information to raise society’s awareness. Moving forward, we will also strengthen activities that can be fed back to our business.
Environmental Conservation
SDG Contribution Activities*
As far as such social contribution activities as environmental conservation and nurturing of the next generation are concerned, which are mainly conducted by business sites and employees, we recommend that employees change their stance and become more aware of the SDGs while continuing existing activities.
By considering which social issues to focus on and why we are working to solve social issues based on the SDGs, we can clarify the significance of our existing activities and undertake a review our activities with the expectation of further improving their effectiveness.
- For details, please refer to Social and SDGs Contribution Activities.
Integrated index SEKISUI Environment Sustainability Index
The SEKISUI Environment Sustainability Index measures the impact of the Group’s corporate activities on the environment (use of natural and social capital) and the degree of contribution to the environment (returns to natural and social capital) as a single index.
We are gradually expanding the scope of coverage to encompass not only the impact on and return of natural capital, but also on and of social capital.
The SEKISUI Environment Sustainability Index integrates the effects of the major items for implementation in the Environmental Medium-term Plan: reducing various impacts on the environment, expanding products and services that contribute to the natural and social environments, and environmental conservation. We established a method for undertaking preliminary calculations in fiscal 2013 and have employed this method since fiscal 2014. Since fiscal 2017, we have applied this index to monitor the progress of the Group's overall environmental management.
In our Environmental Medium-term Plan, which began in fiscal 2020, we have declared our intention to use the SEKISUI Environment Sustainability Index to evaluate not only the natural environment, but also the impact and contribution to the social environment, and to contribute to the return to natural and social capital.
In 2050, even as we expand our business scope, we will promote ESG management while maintaining a return of 100% or more on natural and social capital.
Calculation Results
SEKISUI Environment Sustainability Index calculations based on FY2023 results are as follows. Setting the use of natural and social capital (the impact on the natural and social environments) at 100, the return to natural and social capital (contributions to the natural and social environments) was 106%, confirming that the return to natural and social capital was maintained above 100%.
Trends in the rate of return are analyzed as follows.
-
1.Use (impact) of natural and social capital
A reduction in the impact on natural and social capital is considered to have been made through progress in the shift to renewable energy for purchased power. -
2.Returns to natural and social capital (contributions)
Returns (contributions) from Products to Enhance Sustainability are steadily increasing.
Looking ahead, we will grow as a company and expand our business scope, while maintaining a rate of return to natural and social capital of more than 100%.
In 2050, we aim to realize the sustainable use of the earth’s natural capital and the social capital generated by human society.
In this index, SEKISUI CHEMICAL Group believes that solving issues through products helps to improve the sustainability of the earth and society. We also recognize that improving returns to natural and social capital leads to an improvement in the sustainability of SEKISUI CHEMICAL Group and its products.
- Out_E09
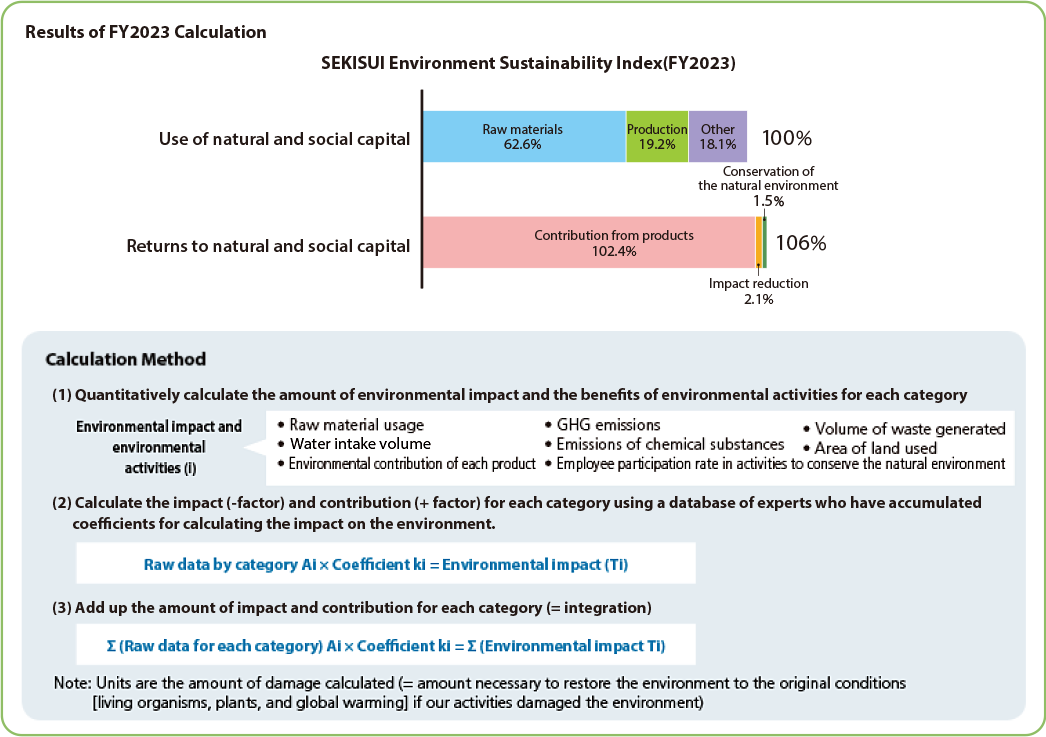
After compiling the raw data in (1), above, the damage calculation-based impact assessment method LIME2, developed for use in Japan by Professor Norihiro Itsubo of WASEDA University, was employed for the calculations in stages (2) and (3).
The LCA database IDEA ver2.3 has been upgraded to ver3.1 in the calculation system MiLCA, which uses LIME2 to calculate the rate of return. We have been using the upgraded MiLCA ver3.1 since fiscal 2023. (MiLCA ver2.3 was used until fiscal 2022).
In MiLCA 3.1, the ascertained data shows that the environmental impact per unit amount is larger, especially in terms of the impact of chemical substances on ecosystems. Under the current Medium-term Management Plan we will place even more importance on the impact on biodiversity, and promote activities aimed at shifting from negative to positive aspects. We have determined that our approach is consistent with the direction MiLCA 3.1 upgrades We will reconfirm the status of current conditions by utilizing the updated calculation system and continue to confirm the progress of activities aimed at addressing environmental issues based on the rate of return from fiscal 2023.
- Note: The impact of the change in MiLCA calculation system approach (upgrade) on the rates of return as verified based on fiscal 2022 data is as follows.
Rate of return on natural and social capital of 127.3% (using MiLCA ver. 2.3) in fiscal 2022.
Rate of return on natural and social capital of 100.1% (using MiLCA ver. 3.1) in fiscal 2022.
| Indicator | Calculation Method |
|---|---|
| SEKISUI Environment Sustainability Index | SEKISUI Environment Sustainability Index = Group-wide amount of natural and social capital returned / Group-wide amount of natural and social capital used Calculating the amount of natural and social capital used and the amount of natural and social capital returned Employing LIME 2 (a damage calculation-based impact assessment method developed for use in Japan by Professor Norihiro Itsubo of WASEDA University) and covering all the four criteria for conservation defined by LIME 2, the impacts on each of human health (including the effects of global warming), societal assets (including the effects of global warming), the effects on plants (reducing interference on growth), and the effects on life (restricting the extinction of living species) were evaluated and then made into a single indicator.
The amount of return to natural and social capital is calculated assuming that the risk of damage to natural capital has been reduced by various environmental contribution efforts of the entire Group compared to the case without such efforts.
Scope of Calculation / Listing by category of calculation: Estimated calculations were conducted using the following assumed conditions:
(1) The differences in contribution to the environment between the relevant products and previous technologies were evaluated qualitatively for each criterion, based on the contribution to the natural and social environments for each life-cycle (the five stages of procurement of raw materials, manufacturing, distribution, use/maintenance, disposal/recycling) in terms of CO2 reductions and energy savings, reductions in waste materials, resource savings, water-savings and the water cycle, preventing pollution, direct preservation of biodiversity, QOL improvements, and other factors. For factors for which a significant difference was estimated, data per product unit was investigated.
(2)Based on the results*3 of these investigations, a coefficient for calculating the impact on the environment for each series of data was multiplied by the data, yielding a calculation of the degree of contribution to the environment of each product unit.
(3)The sales amount for products in each fiscal year were multiplied by the results found in (2) to calculate the degree of contribution to the environment for each product, and the results were included in the calculation. Trial calculation was performed on the effects of products equivalent to around 51% of Products to Enhance Sustainability.
・Direct contribution / Contribution from activities reducing environmental impacts:
*3 Based on individual standards of the divisional companies The effects on the environment relating to production for each fiscal year were compared to [the effects on the environment relating to manufacturing in FY2016 × (revenue in that fiscal year / revenue in FY2016)], and the difference was included in the calculation. There was a proportional relationship between revenue and the effects on the environment relating to manufacturing, based on the idea that the difference was the result of efforts undertaken in the Group’s activities.
・Direct contribution / Conservation of the natural environment:
The Group keeps track of the number of participants and the amount of time spent on each activity. In the case of planting cedar trees, a fixed coefficient of CO2 (1.1 t-CO2 / person-hour) was multiplied by the number of people and the amount of time spent and incorporated into the calculation. Regarding activities in cooperation with local communities which were promoted in Japan, because improving the sustainability of activities through local cooperation and making them conduct the activities on their own (autonomous) were made targets from FY2017, the Group’s ability to work toward this target was weighted against the growth axis and included in the calculation
・Direct contributions / donations:
The amount willing to pay for conservation was deemed equal to the amount of money calculated for damage caused and included in the calculation.
・Direct contribution / Mega-solar:
Amount of electricity generated included in the calculation as generated energy converted to a CO2 basis
|
Scope of Tabulation for Environmental Performance Data
- Note: As far as the scope of environmental performance data aggregation is concerned, SEKISUI CHEMICAL’s main business sites (including all production sites) on a consolidated basis are subject to environmental reporting.
- Scope of Tabulation for Environmental Performance Data(Japan)
- Scope of Tabulation for Environmental Performance Data(Overseas)
Environmental Accounting
We are working to reduce the environmental impact of our business activities while identifying the effects of costs incurred and investments undertaken.
SEKISUI CHEMICAL Group Refers to Public Guidelines and Adds Its Own
SEKISUI CHEMICAL Group employs environmental accounting to promote efficient environmental initiatives as a part of its ESG management endeavors and to fulfill its corporate reporting responsibility. In adopting environmental accounting, our goals are to reduce the Group’s environmental impact and to identify the costs incurred and investments undertaken to contribute to the environment. In the management strategy perspective, we position environment-related investments and expenses as capital costs. Environmental accounting helps to highlight the fact that managing capital costs and improving productivity will improve ROIC.
| Summation period | April 1, 2023 to March 31, 2024 |
|---|---|
| Scope of summation | Production sites, research facilities, housing sales company sites, and Corporate Headquarters departments in Japan. |
| Calculation Method | Based on the Ministry of the Environment’s Environmental Accounting Guidelines 2005 Edition |
| Approach toward summation |
|
Environmental Conservation Costs
| Items | FY2020 | FY2021 | FY2022 | FY2023 | ||||||
|---|---|---|---|---|---|---|---|---|---|---|
| Category | Description of main activities | Costs | Investments | Costs | Investments | Costs | Investments | Costs | Investments | |
| 1) Costs within business areas | (1) Pollution prevention costs | a. Air | 369 | 62 | 319 | 98 | 355 | 16 | 312 | 17 |
| b. Water | 130 | 77 | 85 | 68 | 110 | 198 | 93 | 197 | ||
| c. Soil | 0 | 7 | 0 | 4 | 0 | 7 | 0 | 2 | ||
| d. Noise | 12 | 1 | 1 | 0 | 2 | 0 | 2 | 0 | ||
| e. Vibration | 0 | 0 | 0 | 0 | 0 | 0 | 0 | 0 | ||
| f. Odor | 255 | 0 | 242 | 4 | 235 | 0 | 163 | 5 | ||
| g. Ground | 106 | 3 | 105 | 0 | 102 | 0 | 76 | 2 | ||
| h. Others | 304 | 8 | 307 | 29 | 315 | 5 | 211 | 5 | ||
| Subtotal | 1,176 | 157 | 1,058 | 202 | 1,118 | 226 | 856 | 227 | ||
| (2) Countermeasures against global warming | a. Global warming (including energy saving) | 686 | 588 | 114 | 833 | 132 | 510 | 171 | 690 | |
| b. Ozone layer | 100 | 18 | 6 | 33 | 6 | 4 | 4 | 39 | ||
| c. Others | 0 | 4 | 0 | 55 | 0 | 14 | 1 | 0 | ||
| Subtotal | 786 | 611 | 120 | 921 | 138 | 528 | 176 | 729 | ||
| (3) Resource recycling costs | a. Effective utilization of resources | 63 | 17 | 6 | 31 | 10 | 12 | 6 | 46 | |
| b. Water conservation, utilization of rainwater, etc. | 4 | 4 | 7 | 28 | 8 | 6 | 8 | 105 | ||
| c. Waste volume lightening, reduction, recycling, etc. | 176 | 93 | 177 | 76 | 180 | 362 | 140 | 141 | ||
| d. Waste processing, disposal, etc. | 6,293 | 4 | 6,477 | 106 | 4,878 | 1 | 4,775 | 2 | ||
| e. Others | 18 | 1 | 1 | 6 | 19 | 14 | 1 | 45 | ||
| Subtotal | 6,553 | 119 | 6,668 | 246 | 5,095 | 394 | 4,930 | 339 | ||
| 2) Upstream/downstream costs | Cost increases due to recycling of products such as those manufactured and sold, greener purchasing, etc. | 113 | 0 | 109 | 28 | 161 | 0 | 145 | 0 | |
| 3) Administrative costs | Environmental education, EMS certification, running costs for green action organization, information disclosure, etc. | 2,385 | 12 | 2,206 | 1 | 1,624 | 2 | 1,929 | 2 | |
| 4) Research & development costs | Research and development on environmental conservation | 3,740 | 313 | 15,009 | 813 | 16,128 | 760 | 6,528 | 8 | |
| 5) Social activities costs | Social contributions, etc. | 112 | 98 | 78 | 0 | 128 | 0 | 201 | 0 | |
| 6) Environmental damage costs | Nature restoration, etc. | 30 | 2 | 57 | 5 | 63 | 8 | 44 | 0 | |
| Total | 14,896 | 1,311 | 25,306 | 2,216 | 24,455 | 1,918 | 14,809 | 1,306 | ||
Substantive Economic Effects of Environmental Conservation Measures
| Description of effects | FY2020 | FY2021 | FY2022 | FY2023 | Remarks | |
|---|---|---|---|---|---|---|
| Revenue | (1) Profit on sales of valuable waste resources | 176 | 139 | 116 | 126 | Profit on sales of valuable waste resources from promotion of waste segregation and recycling |
| (2) Revenues from sale of electricity | 402 | 334 | 348 | 337 | Revenues from sale of electricity generated by megasolar facilities | |
| Cost savings | (3) Cost savings through energy-saving activities | 1,311 | 256 | 420 | 803 | Including savings through utilization of co-generation |
| (4) Cost savings through waste-reduction activities, etc. | 502 | 463 | 522 | 284 | Reductions through optimization, reuse, and zero emissions activities | |
| Total | 2,392 | 1,191 | 1,407 | 1,550 | ||
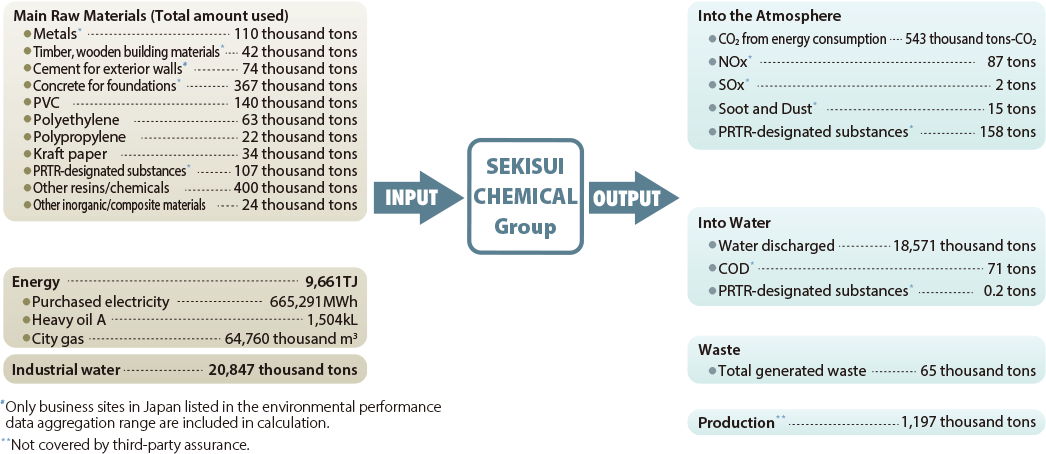
Material Balance
SEKISUI CHEMICAL Group releases information on the resources and energy used in its business activities (input) and on the substances that have an environmental impact generated by those activities (output).
- Out_E12
Material balance (Japan and overseas total)
FY2023 Results
Setting Self-management Targets
SEKISUI CHEMICAL Group has set its own environmental management targets. This includes reducing emissions into the atmosphere and water, which are stricter than legal regulations. Each business site closely follows these internal targets. We aim to prevent environmental accidents before they occur by conducting internal environmental audits to uncover latent environmental risks.
In addition, we are developing comprehensive activities by sharing information on new legal and regulatory trends as well as incidents at other companies within the Group.
In fiscal 2023, there were no major violations of environmental laws and regulations related to such issues as the treatment of waste, water discharge, air emissions, and soil pollution. There were also no reports on incidences of administrative guidance.