統合指標
統合指標「SEKISUI環境サステナブルインデックス」
SEKISUI環境サステナブルインデックスは、積水化学グループの企業活動が環境に与える負荷(自然・社会資本の利用)と環境への貢献の度合い(自然・社会資本へのリターン)をひとつの指標で表したものです。環境中期計画における重要実施項目である各種環境負荷削減、自然・社会環境に貢献する製品・サービスの拡大、環境の保全等の項目による効果をこの指標で統合化し、2014年度から試算を行っています。2017年度からは、このインデックスを、会社の環境経営全体の進捗をモニターする指標として活用しています。
環境中期計画(2017-2019)の3年間では90%を目指してきましたが、最終年度である2019年度には104.5%のリターン率でした。
2020年度からの環境中期計画において、SEKISUI環境サステナブルインデックスとしては、自然環境のみならず社会環境への負荷や貢献を評価し、自然資本および社会資本へのリターンに貢献していくことを宣言しています。2050年には、業容を拡大していく中でも、自然資本に加えて社会資本に対し、100%以上のリターンを維持しながらESG経営を推進していきます。
算出の結果
2021年度の実績を用いたSEKISUI 環境サステナブルインデックスの計算結果は、自然・社会資本の利用(自然・社会環境への負荷)を100とすると、自然・社会資本のリターン(自然・社会環境への貢献)は117.7%となりました(2019年度104.5%から13.2ポイント向上、2020年度121.9%から4.2ポイントダウン)。
リターン率の推移については以下のように分析しています。
-
(1)自然・社会資本の利用(負荷)について
新型コロナウイルスの影響が徐々に払拭され、コロナ禍発現前の通常時の製品生産体制に戻ったことが環境負荷の増加の一因。ただし、エネルギーやサプライチェーン影響などはコロナ禍前の2019年度と比較すると自然・社会資本への負荷は減少。これは電力の再生可能エネルギーの転換や、サプライヤーや製品使用時の使用エネルギーが低くなる製品の販売(=ZEH仕様住宅)などの成果と考えられる。 -
(2)自然・社会資本のリターン(貢献)について
サステナビリティ貢献製品によるリターン(貢献)は着実に増加傾向にある。一方で環境保全活動については、事業所における新型コロナウイルスの感染対策などの方針により、活動の実施や内容が制限され、貢献は減少している。
今後は、企業として成長し、業容を拡大していく一方で、自然・社会資本へのリターンにおいて100%以上を持続していきます。そして、2050年には地球上の自然資本および、地球上の人間社会において生み出された社会資本の持続的な利用の実現を目指します。
このインデックスにおいて、製品による課題解決を進めることは地球および社会のサステナビリティ向上に貢献し、自然・社会資本へのリターンを向上させていくことは積水化学グループおよび製品のサステナビリティ向上につながると考えています。
- 11-05
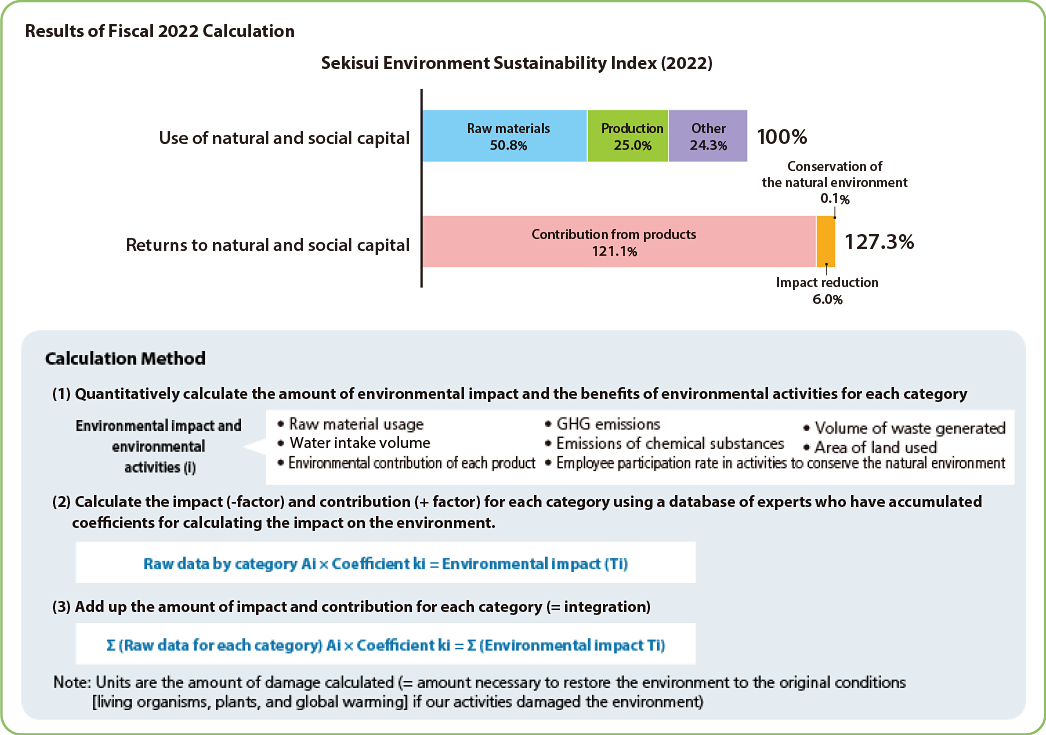
上述の(1)で元となるデータを収集した後、(2)(3)の段階では、東京都市大学 伊坪教授らによって開発された日本版被害算定型影響評価手法「LIME2」を用いて計算を実施しています。
| 指標 | 算定方法 |
|---|---|
| SEKISUI環境サステナブル インデックス |
SEKISUI環境サステナブルインデックス=グループ全体の自然資本のリターン量/グループ全体の自然資本の利用量 自然資本の利用量・自然資本のリターン量の算出 LIME2(東京都市大学伊坪教授らにより開発された日本版被害算定型影響評価手法)を用い、LIME2の定める4つの保護対象すべてを対象とし、「人間健康(地球温暖化の影響含)」「社会資産(地球温暖化の影響含)」「植物への影響(生長阻害の軽減)」「生物への影響(生物絶滅の抑制)」ごとに影響評価し、単一指標化
自然資本へのリターン量は、グループ全体の各種環境貢献の取り組みによって、取り組みを行わなかった場合と比べて自然資本への被害のリスクが低減したとして算出
<<算定範囲/算定分類別で記載>>以下の想定条件で試算
|