Company Overview for Investors

| Market: Tokyo | Symbol: 4204 | ISIN:JP3419400001 | Sector: Chemicals |
|---|
SEKISUI CHEMICAL, established in 1947, has been carrying out business while successively meeting social demand by new materials and technologies such as plastic molding, and has been contributing to resolve social issues. SEKISUI CHEMICAL Group maintains BtoC businesses primarily in the new housing construction industry and BtoB businesses that handle conductive fine particles, interlayer films for automotive laminated glass, water supply/sewerage pipes, and diagnostic reagents and others. Similarly, we carry out business through the three “High Performance Plastics,” “Housing,” and “Urban Infrastructure & Environmental Products” divisional companies as well as the Medical Business in the fields of “Residential and Social Infrastructure Creation” and “Chemical Solutions.” In aim of realizing both a sustainable society and the sustainable growth, the Group will continue to provide the products and services that support people’s everyday lives around the world along the strategy axis of ESG management of bringing peace of mind for the future.
Key Figures
Years ended March 31
| Millions of yen | FY2023 | FY2024 | FY2025 |
|---|---|---|---|
| Net sales | 1,256,538 | 1,297,754 | 1,309,281 |
| Operating profit | 94,399 | 107,951 | 106,477 |
| Ordinary profit | 105,921 | 110,958 | 117,215 |
| Profit attributable to owners of parent | 77,930 | 81,925 | 75,174 |
| Cash flows from operating activities | 106,632 | 119,231 | 78,301 |
| Cash flows from investing activities | -18,515 | -61,508 | -69,103 |
| Cash Flows from financing activities | -53,023 | -61,200 | -46,546 |
| Profit attributable to owners of parent per share (yen) | 183.48 | 195.93 | 182.70 |
| Dividends per share (yen) | 74 | 79 | 80 |
| Net assets per share (yen) | 1,880.30 | 1,933.56 | 2,108.44 |
| Total assets | 1,323,243 | 1,330,786 | 1,427,933 |
| Net assets | 820,925 | 835,366 | 881,125 |
| Equity*1 | 792,329 | 807,348 | 851,190 |
| Capital expenditures | 60,606 | 70,274 | 92,911 |
| Depreciation | 51,195 | 52,361 | 56,872 |
| Amortization of goodwill | 1,477 | 1,395 | 1,252 |
| R&D expenditures | 41,701 | 44,249 | 45.595 |
| Operating profit margin (%) | 7.5 | 8.3 | 8.1 |
| ROE (%)*2 | 10.4 | 10.2 | 9.1 |
| ROA (%)*3 | 8.3 | 8.4 | 8.5 |
| ROIC (%)*4 | 7.3 | 8.1 | 7.6 |
| EBITDA *5 | 147,072 | 161,707 | 164,602 |
| Equity-to-asset ratio (%) | 59.9 | 60.7 | 59.6 |
| Number of employees | 26,929 | 26,918 | 26,752 |
| Number of shares issued (Thousands of shares) | 448,507 | 444,507 | 430,507 |
- *1: Equity= Shareholders' equity including accumulated other comprehensive Income
- *2: ROE=Profit attributable to owners of parent/Average equity
- *3: ROA= Ordinary profit/Average total assets
- *4: ROIC= After tax operating profit/Average invested capital (Fixed assets + working capital)
- *5: EBITDA= Operating profit + Depreciation + Amortization of goodwill
Composition (FY2025)
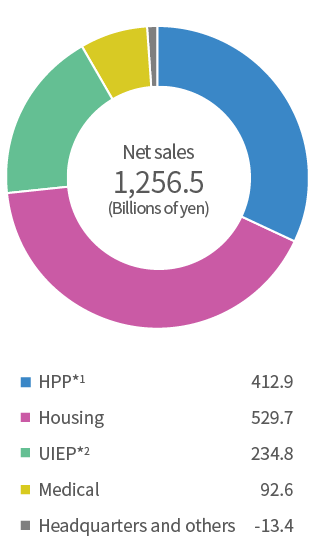
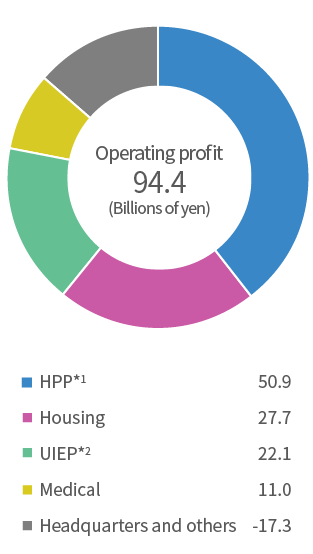
- *1: High Performance Plastics
- *2: Urban Infrastructure Environmental Products
Major Shareholders
(As of March 31, 2026)
| Name | Number of Shares Held (thousand shares) | Percentage of Ownership (%) |
|---|---|---|
| The Master Trust Bank of Japan, Ltd. (Trust Account) | 59,876 | 14.78 |
| Custody Bank of Japan, Ltd. (Trust Account) | 21,498 | 5.30 |
| Employees Stock Ownership Plan | 12,330 | 3.04 |
| The Dai-ichi Life Insurance Company, Limited | 12,153 | 3.00 |
|
Sekisui House, Ltd. |
7,998 | 1.97 |
|
National Mutual Insurance Federation of Agricultural Cooperatives |
7,302 | 1.80 |
|
STATE STREET BANK AND TRUST COMPANY 505001 |
6,901 | 1.70 |
|
JP MORGAN CHASE BANK 385781 |
5,561 | 1.37 |
|
STATE STREET BANK AND TRUST COMPANY 505103 |
4,275 | 1.05 |
|
STATE STREET BANK AND TRUST COMPANY 505223 |
4,231 | 1.04 |
- *1: The Company maintains 25,414,787 shares of treasury shares, which does not include the holdings of the major shareholders.
- *2: The percentage of ownership is calculated after subtracting the treasury shares from the total number of outstanding shares.
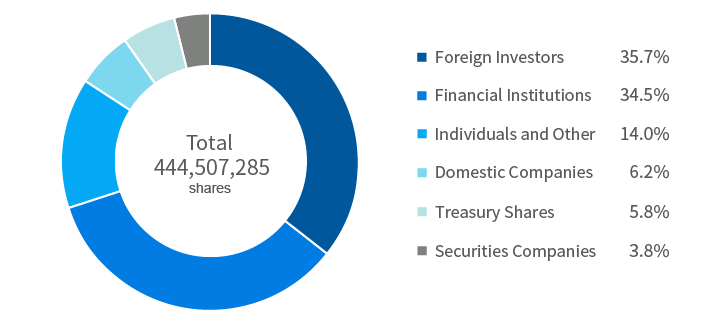
Breakdown of Shareholders (As of March 31, 2026)