|
|
|
|
|
|
|
|
<3>Completed the survey of water risks at production sites. Implement a detailed survey in future |
|
|
SEKISUI CHEMICAL CO., LTD. (President: Teiji Koge, hereinafter called "Sekisui Chemical") and the Sekisui Chemical Group aims for an "Earth with maintained biodiversity" with regard to the long-term environmental vision "SEKISUI Environment Sustainable Vision 2030" (hereinafter called the "Long-term Vision") established in FY2014.
|
"SEKISUI Environment Sustainable Vision 2030" |
|||||||
|
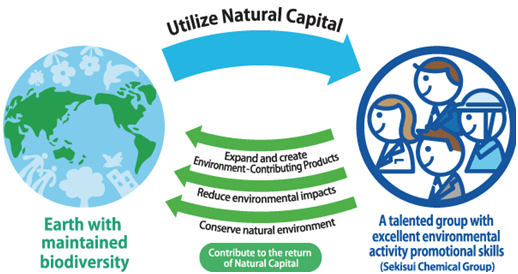
Since FY2014, the environmental midterm plan "SEKISUI Environment Sustainable Plan: Take-off" (FY2014 - FY2016) started as the first step in achieving this long-term vision. To achieve the targets set by the midterm plan, Sekisui Chemical is advancing environmental management that balances both ecology and economy by placing environmental contributions at the heart of management.
1. Outline of "SEKISUI Environment Sustainable Plan: Take-off" (FY2014-2016)
|
Activity item |
Midterm Management Plan Target (FY2016) |
|
|
Expand and create Environment-Contributing Products |
Expanding markets |
Sales ratio: 50% or higher |
|
Creation |
30 or more registrations (in 3 years) |
|
|
Reduce environmental impact |
Reduction of GHG emission |
Maintain total emission levels |
|
Energy reduction |
Reduction of 3% t/t (vs. FY13) |
|
|
Reduction of waste generation |
Reduction of 12% t/t or more (vs. FY13) |
|
|
Conserve natural environment |
Improving the quality of green spaces within business sites |
Raise 10 points in the corporate green space evaluation standards (Land-Use Report Card®*1) (vs. FY13) |
|
Sekisui Environmental Week |
Participation of all employees at all sites |
|
|
|
*1) Land-Use Report Card®: |
A sheet evaluating the extent of contributions to biodiversity in land use for business sites, based on the promotional guidelines for business land managers issued by Sustainable Business Sites®. |
|
|
2. Progress of "Sekisui Environmental Sustainable Plan:Take-off" (FY 2014-2016)
FY2014 results and future plans regarding important implementation items of the environmental midterm plan are described in the table below.
|
Activity item |
Index |
2014 |
2014 |
Achi |
2015 |
Implementation |
2016 |
|
|
Environment |
Expanding markets |
Sales ratio |
44% |
44.5% |
○ |
47% |
-Visualize environmental value (contribution) and supporting businesses from the viewpoint of environmental contribution -Resister Environment-Contributing Products by area -Reinforce new product registration (new categories, etc.) |
50% |
|
Creation |
New registrations |
10 |
22 |
○ |
10 |
30 |
||
|
Reduce environmental impact
|
Reduction of |
Amount of |
Maintain total emission levels |
△2.5% |
○ |
Maintain total emission levels |
-Promote ECO-JIT activities both in and outside Japan -Rollout examples of energy-saving improvements
|
Maintain total emission levels |
|
Energy reduction |
Amount of energy consumed per unit of output |
Reduction of 1% t/t (compared to FY13) |
+3.6% |
× |
|
Reduction |
||
|
Reduction of waste generation |
Amount of waste generated per unit of output |
Reduction of 4% t/t (vs. FY13) |
+8.6% |
× |
Reduction of 8% t/t
|
-Japan: Expand “waste material conferences” to achieve actual results -Overseas: Reduce by centering on zero waste emissions activities |
Reductionof 12% t/t |
|
|
Conserve natural environment |
Improving |
Corporate |
3 points up |
4.6 points up |
○ |
6 points up (vs. FY13) |
-Involve by proposals for each business site |
10points up |
|
Sekisui Environmental Week |
Employee participant ratio
|
60% |
54% |
× |
80% |
-Pre-announce and verify activities -Rollout favorable cases -Introduce personal activities |
100% |
|
|
|
|
|
|
|
|
|
|
|
|
System reinforcement |
Identification of water |
Complete water risks survey |
Complete water |
○ |
Water risk identification and countermea-sure proposals |
-Implement detailed surveys at 7 overseas business sites |
Water risk identification and countermea |
|
|
Calculation based on |
Complete actual results calculation |
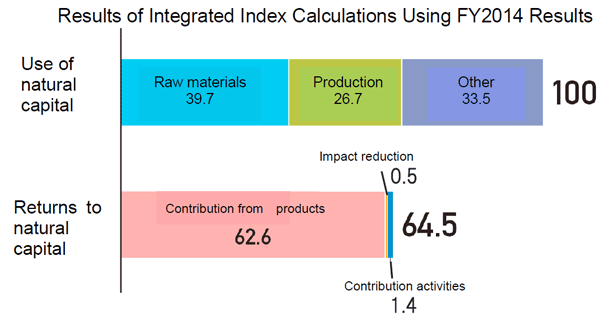
Rated 64.5 for return of natural capital, indexed to 100 as the amount of natural capital used |
○ |
Feasibility judgment of management index |
-Calculate Index at typical business sites |
Discussion of calculations and utilization |
||
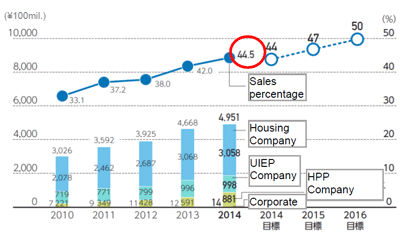
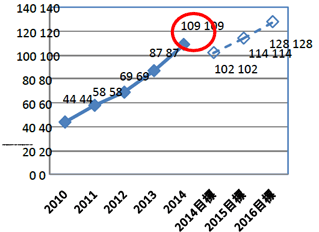
Create and Expand markets of its Environment-Contributing Products<1>
(1) Results: Targets achieved
Sales ratio: 44.5%, number of newly-registered products: 22, total number of registrations: 109
Started calculations of level of environmental contribution by each product
|
Sales amount/ratio trends of |
Trends in registration numbers |
|
|
|
(2) "Sales expansion" factors:
In FY2014, targets were reached through the following market expansions and new product registrations.
-Expansion of overseas markets for sound and solar control interlayer film, and electronics-based intermediate materials
-Increased registrations in new business fields (housing renovation menus, products developed overseas, intermediate materials for LCDs, medical products, etc.)
|
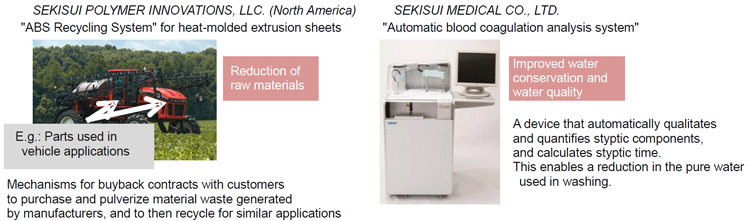
Examples |
|
|
|
|
(3) Details of "level of product environmental contributions":
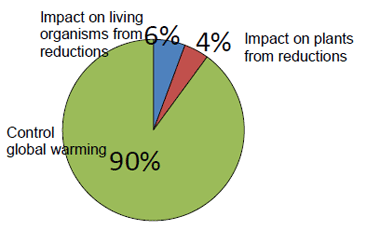
Started to visualize environmental contributions and visualized environmental contributions for each product and service that makes up 90% of the sales of Envionment-Contributing Products.
-Taking the calculated amount of environmental contributions to be 100%, the breakdown of the extent of contribution for each of the three environmental issues “extinction of living organisms”, “hindering growth of plants”, and “global warming” is as follows: Impact on living organisms from reductions: 6%, Impact on plants from reductions: 4%, and Control global warming: 90%.
|
Analysis of the level of contributions for the 3 environmental issues |
|
|
|
|
|
Characteristics of Sekisui Chemical Group products that
contribute to the environment |
|
|
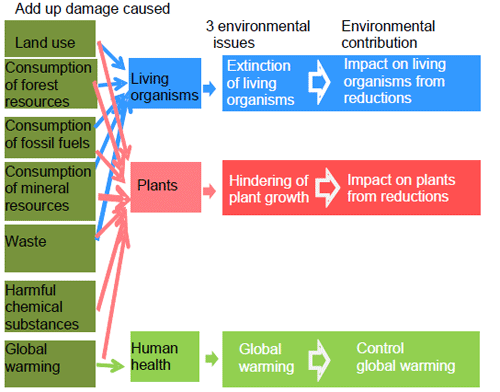
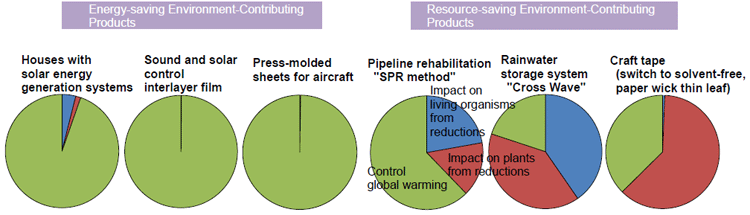
-Calculation results per product (see examples below) confirmed that among energy-saving Environment-Contributing Products, the percentage of the contribution to controlling global warming is high, and that among resource-saving Environment-Contributing products, construction methods and services that include construction and machining are effective in reducing the impact on living organisms and plants.
|
|
*Calculation Methods
1. Determine the functional units of the product to be calculated and the product for comparison, and implement a qualitative comparison of the environmental impact during the product's lifecycle.
2. Gather data for items where there is thought to be a difference. Further, sample the coefficients of the environmental impact commensurate with the raw data that has been gathered based on the LIME2*2 method, and calculate the extent of the environmental contribution for the functional units of the product by multiplying with the data.
3. Multiply the result by the sales results for the fiscal year to calculate the extent of the environmental contribution of the product for 1 year.
|
*2) LIME2: |
An environmental impact evaluation method developed by Professor Norihiro Itsubo at Tokyo City University. LIME2 was customized for the calculations. Coefficients in the "MiLCA" database were used.. |
(4) Future:
-Visualize environmental value (level of contribution), and support businesses from the viewpoint of environmental contributions
-Register Environment-Contributing Products by area (E.g., encourage the spread of environmental contribution technology in developing countries, etc.)
-Reinforce new product registration (new categories: "Disaster prevention/disaster reduction", etc.)(E.g.: Non-flammable polyurethane, highly durable products for infrastructure, etc.)
Reducing GHG Emissions/Reducing Amount of Energy Used
(1) Results: GHG emissions: Reached target reduction of 2.5%
Amount
of energy consumed per unit of output: Targets not achieved due to 3.6% increase
(2) Factors:
GHG Emissions
(+) Promoted energy reduction by reviewing all equipment
(+) Promoted common knowledge of energy reduction measures through caravans
and energy reduction conferences, etc.
Amount of energy consumed per unit of output
(-) Production bases of domestic businesses was recognized
(-) Policy deployment at overseas businesses is still in the development stage
(3) Future:
-Rollout energy-saving improvements examples
-Reinforce all energy-saving activities (increase visibility, reinforce ECO-JIT*3 activities, encourage the switch to LED lighting, etc.)
-Reinforce environmental management activities at overseas business sites (ECO-JIT activities, etc.)
|
*3) ECO-JIT: |
Activities to reduce energy costs by thoroughly identifying energy losses within the production process, and improving (upgrading) production |
Reduction of waste generation
(1) Results: Amount of waste generated per unit of output: Targets not achieved 8.6% increase
(2) Factors: Production bases of domestic businesses was recognized
Policy
deployment at overseas businesses is still in the development stage
(3) Future:
-Share waste generation reduction methods throughout Sekisui Chemical Group
-Promote company-wide recycling technologies
-Promote zero waste emissions at overseas business sites
Improving the Quality of Green Spaces within Business sites <2>
(1) Results: Targets achieved. 4.6 points increase according to an evaluation using the Land-use Report Card®
(2) Details: 62% of business sites are up 3 points, and 5 business sites are up 10 or more points
|
|
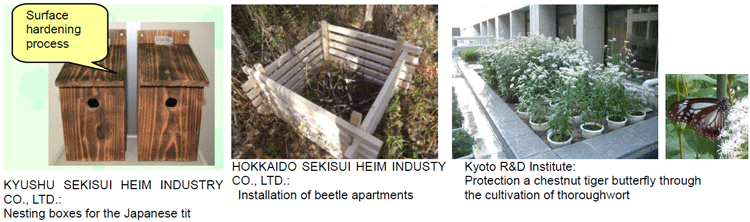
(3) Factors: Implementing caravans (proposed activities suitable to the business sites based on survey results)
(4) Future: Propose involvement to each business site
-Survey what organisms live in the sites (HOKKAIDO SEKISUI HEIM INDUSTRY CO., LTD., KYUSHU SEKISUI INDUSTRY CO., LTD.)
-Create a biotope through employee participation (Kyoto R&D Institute, etc.)
-Create species pamphlets through employee participation
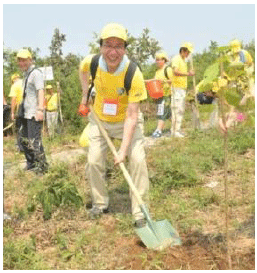
(2nd) Sekisui Environmental Week 2014
|
(1) Results: Employee participant ratio 54%, business site participation ratio 88% The main event was the cherry tree planting activities in Suzhou,
China
(2) Factors: Insufficient permeation of activities and insufficient promotion of personal activities
(3) Future: -Pre-announce and verify activities -Rollout favorable cases -Introduce personal activities |
|
Water Risks<3>
(1) Results: Completed the survey of water risks at world-wide production sites
(2) Details: Separate areas and water risk details (water intake, water discharge, location) by level, and identify the following trends.
-Water intake: Much use of underground water
-Water discharge: Much discharge into water areas that comprise water sources
-Overall, Chinese business sites carry much water risk
(3) Future: Implement detailed surveys at 7 overseas business sites
Integrated Index <4>
(1) Results: Calculated using integrated index (="SEKISUI Environment
Sustainability Index") of amount of natural capital use and return amount
by business activities
Indexed
to 100 as the amount of natural capital used, its business activities rated
64.5 for return of natural capital in fiscal 2014
(2) Details: Comprehensive index calculated using FY2014 results.
-Verified the size of the impact of the supply chain through raw materials and products used
-Reconfirmed the importance of environmental contributions from products
-Identified potential environmental contributions per product
|
|
*Calculation Methods
1. Gather burden data contributing to negative impacts and contributing data*4 contributing to positive impacts on natural capital (results of activities).
2. Sample coefficients for environmental impact according to the items based on the LIME2 database, and multiply by the data.
3. Add up the impact of each factor to unify.
|
*4) Contributing data: |
Calculate the difference between each comparison product over the Environment-Contributing Product as its contribution |
(3) Future:
-Discuss countermeasures to actualized problems, and review and discuss items requiring long-term involvement
-Thoroughly identify whether operations are feasible as a company-wide progress index that shows the extent to which the vision has been achieved
-Discuss calculations and actions as index per business site to promote involvement that makes good use of the business site characteristics
Disclaimer
This press release may contain forward-looking statements. Such forward-looking statements are based on current expectations and beliefs and are subject to a number of factors and uncertainties that could cause actual results to differ materially from those expressed or implied by such statements due to changes in global economic, business, competitive market and regulatory factors.